
Sunday, January 12, 2020

Saturday, June 1, 2019
Storing Data into Excel Tables
Advantages of storing Data into Excel Tables
The main benefits of converting data into Excel tables will be explained
under the following topics.
- Always visible Header Row
- Banded rows and formatting
- Sorting and filtering
- Using calculated columns
- Total row and calculating table data
- Inserting and deleting rows and columns
- Using structured reference
- Easy data entering
- Ensuring data integrity
- Dynamic charts
01. Always visible Header Row
When you
scroll down your table and when the header row of the table goes underneath the
ribbon, the default column title of Excel (A, B, C…) turs into your table’s
columns titles.
02. Banded rows and formatting
When you convert your range of data into an Excel
table, by default the Excel shades every other row in the table making them
easy to read. You can turn on/off the banded-row option from Table
Style Options under the Design tab. You can also have banded
columns. The style of the table can be changed from the Table Styles
option under the Design tab.
03. Sorting and filtering
When you convert a set of data into an Excel table,
the filter drop-down lists are automatically added to the header row of the
table. You can sort data ascending/ descending order, by color and you can set
custom sort order. You can also filter the table data and show only the
required set of data. The filter buttons can turn on/off at any time by using
the filter button checkbox in the Design tab.
04. Calculated columns
If you enter a formula in a cell,
that formula is applied to all the other cells in that table column. This
column named as a calculated column. The calculated column automatically extend
to include the additional rows added to the table.
05. Total row and calculating table data
The “total row” can be turned on/ off
from the checkbox in the design tab. You can quickly do the calculations by
selecting the required function from the drop-down menu. You can access the all
other excel function from the “more functions…” options in the
bottom of the drop-down menu. If you apply a filter, the total row only shows
the calculations for the visible data.
The keyboard shortcut for total row is Ctrl+Shift+T
06. Inserting and deleting rows and columns
In Excel tables, you can insert/delete columns or
rows without affecting other parts of the worksheet i.e. the column insert
inside the table does not continue to the section below the table.
There are a number of ways that you can add columns
and rows into tables. Among them, using mouse right button will be the easiest
way.
To add a new row below the last row of the table,
you can simply use the “Tab” key of the keyboard.
07. Using structured reference
When you use Excel tables, you can use table name
and names of columns in functions i.e. instead of =SUM(E2:E6) you
can use =SUM(Table12[Line Total]). With the structured reference,
the function itself clearly explain what it does. This is more useful when you
are working with a large number of Excel sheets.
08. Easy data entering
It is very easy to do data entry tasks with excel
tables. When you enter data to a new row at the end of the table, the table is
automatically expanded to include that row. The always visible header row also
an advantage. You can also generate a data entry form connected to the Excel
table to make the data entry simpler.
09. Ensuring data integrity
You can apply data validation to specific columns
in the Excel table. For example, you can add data validation rule to a column
to accept only values with text length greater than 3.
10. Dynamic charts
As explained in above 8th point, when
adding a new row next to the last row of the table the table dynamically
expands to include that row. As such, if you create a chart based on an Excel
table the chart is also updated with the new values you added to the table.
Convert the data into excel table
You can use one of the following two methods to convert Excel data into a table.- Select the dataset and got to Insert and select table option in the table group.
- Select the dataset and press Ctrl+T
Or
•
Select a cell within your data.
•
Select Home > Format as Table.
•
Choose a style for your table.
•
In the Format as Table dialog box, set your
cell range.
•
Mark if your table has headers.
•
Select OK.
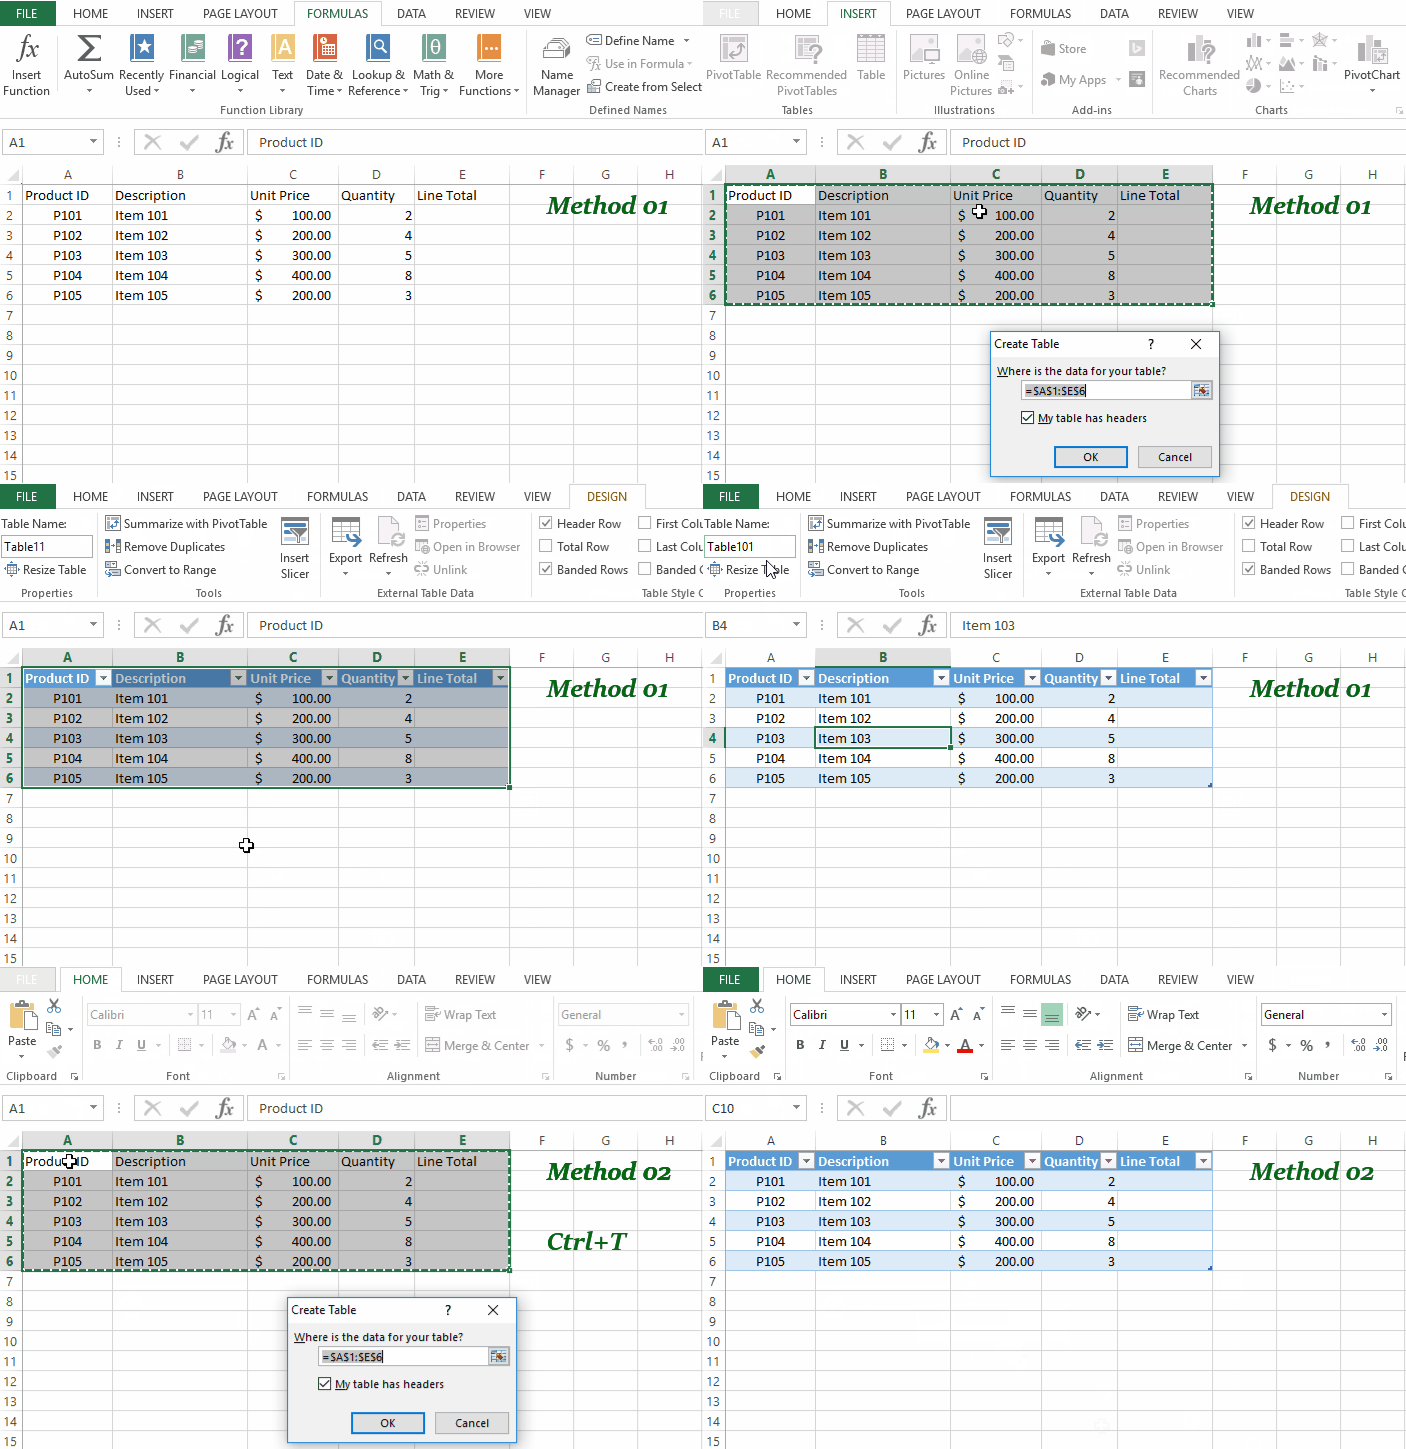
Courtesy: https://www.bpwebs.com/
Subscribe to:
Posts (Atom)